When you have a "mystery" bug to solve, tracepoints are a vital part of your debugging arsenal. Single stepping and looking through code can be S-L-O-O-O-O-W and if you don't even know what you're looking for, it can consume hours and hours of effort. Tracepoints really speed things up. They're like breakpoints that don't break. In a way, they go back to the old "printf debugging" -- but you don't need to make code changes and recompile to change them.
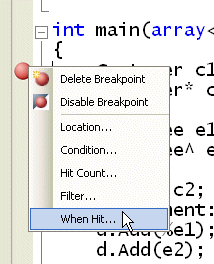
To set a tracepoint, first set a breakpoint, then right-click on the red dot that appears in the margin and choose When Hit:

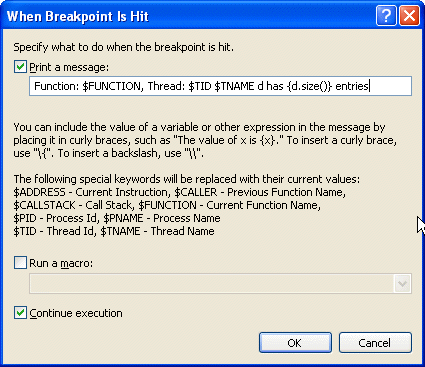
In the dialog that appears, click the Print A Message box and edit the starter message you are given. You can include any expression in braces and it will be evaluated when control reaches the tracepoint:

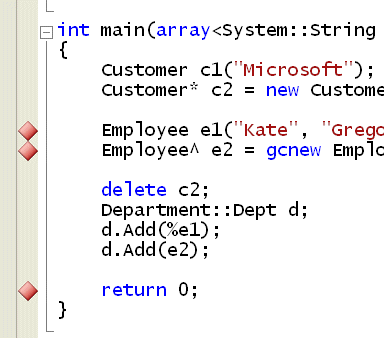
Leave the Continue Execution box checked so that you don't break. Tracepoints are identified by red diamonds instead of red dots:

The output from the tracepoints appears in the output window of your debug session:

You can set up something suspicious, let it run, then pore through the tracepoint output and see what you learn. It's a huge timesaver when you're tackling a "we don't even know where to start" bug. Plus, if the issue is related to threading or async issues in any way (and you know me, I keep preaching we will all be facing async issues eventually) then you don't have to worry that pausing execution suppresses the collisions. I recently helped a client solve a big hairy this-stuff-fails-for-our-biggest-customer-only bug using tracepoints... and a few other tricks I will cover in upcoming posts.
Try it!